|
|
FRINGE 96 |
|
|
|
|
|||
| Wei Xu & Ian Cumming |
Radar Remote Sensing Group, Dept. of Electrical Engineering, The University of British Columbia, 2356 Main Mall, Vancouver, BC, Canada V6T 1Z4. E-mail address: weix or ianc@ee.ubc.ca http://www.ee.ubc.ca/sar/group.html | |
Keywords: Phase unwrapping, Region-growing, Cut-line, Weighted-Least-Squares
Go to Table of Contents of this paper.
2. The Region-Growing Algorithm
3. The Sardegna ERS-1 Interferogram
4. Unwrapping Results
4.1 Unwrapping with the Region-Growing Algorithm
4.2 Unwrapping with the Cut-Line Algorithm
4.3 Unwrapping with the Weighted Least Squares Algorithm
5. Comparison with Map Elevations
5.1 Comparison of Phase Values
5.2 Comparison of Elevations from the Map
5.3 Discussion
or scroll down for body of paper.
Phase unwrapping has been studied for over 20 years, but unwrapping of noisy interferograms still presents a challenge (Robinson & Reid, 1993). Phase unwrapping of SAR interferograms is even more difficult because of the side-looking configuration of SAR which causes shadow, foreshortening and layover. A number of phase unwrapping algorithms for SAR interferograms have been proposed in recent years (Goldstein, Lin, Prati, Valero). However, none of the existing phase unwrapping algorithms give satisfactory results when noisy and/or dense fringes occur.
We have developed a new region-growing phase unwrapping algorithm, which is designed to cope with very noisy interferograms (Xu & Cumming, 1996). In many algorithms, the success of phase unwrapping depends upon the path chosen to perform the unwrapping, and this choice has been troublesome for these algorithms. The region-growing algorithm minimizes unwrapping errors by starting at pixels of high data quality (typically of high coherence), and proceeding along paths where unwrapping confidence is high. The algorithm is also able to correct unwrapping errors to a certain extent, and to stop their propagation. The algorithm achieves these goals in the following way:
One of the strengths of the algorithm is that if a pixel cannot be reliably unwrapped from one direction, its unwrapping will likely be attempted from another direction. In this way, the algorithm tends to penetrate deeper into low-coherence regions than other algorithms, and is more successful in joining regions separated by low-coherence boundaries.
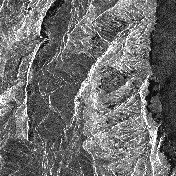
We are using ERS-1 data of Sardegna, Italy, from frame 801, orbit 241, August 2, 1991 and orbit 327, August 8, 1991. We are focussing on a 16 x 16 Km portion of the scene, towards the far range of the full scene, centered at 40o 8' N, 9o 32' E. The 512 x 512 pixel magnitude image is shown in Figure 1, after smoothing by 2 times in range and 8 times in azimuth. The pixel size is 32 x 32 meters, and range is plotted from left to right. The main part of the scene is quite mountainous, with the Mediterranean Sea along the right edge of the scene. According to the FRINGE baseline listings (Solaas, 1994), the perpendicular baseline is 127 meters.
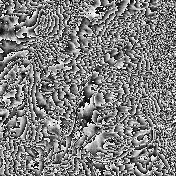
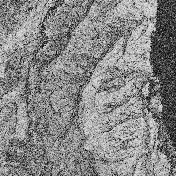
The SAR signal data was processed to SLC images, registered, approximately flattened, and the interferogram was formed. The phase of the interferogram is shown in Figure 2, with the corresponding local coherence shown in Figure 3. Phase smoothing and coherence calculation are based on the 2:1 and 8:1 range and azimuth averaging ratios.
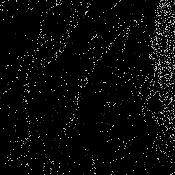
This SAR interferogram is considered to be difficult to unwrap because of its large areas of low coherence, which are mainly caused by layover due to the extreme local topography. These areas of low coherence segment the interferogram into many pieces, which creates structural difficulties for the unwrapping algorithms. For example, 17995 residues or phase singularities are found in this small interferogram. The distribution of the residues is shown in Figure 4.
In this paper, we will compare the results of unwrapping the Sardegna interferogram using three different algorithms. First, we will use the region-growing algorithm described above. Then, we will use two other unwrapping algorithms which are in popular use nowadays.
The Sardegna interferogram of Figure 2 was unwrapped using the region-growing algorithm with typical quality control parameters. A total of 255 regions were used in the unwrapping. About 93% of the land area was unwrapped by the RG algorithm. The algorithm joined most of the land area into one region, which is shown in Figure 5. The algorithm automatically recognizes that the low-coherence sea area on the right hand side should not be unwrapped. The low-coherence regions caused by layover in the land area are prominent in the figure, as they are also left wrapped, although small isolated unwrapped areas may be present in some of the black areas.
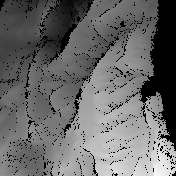
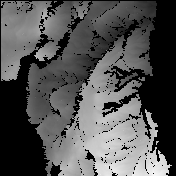
Unwrapping with the "cut-line" (CL) algorithm was implemented by Dr. Ian Joughin of JPL (Joughin, 1995), using a modified version of the original CL algorithm (Goldstein, et al., 1988). The phase of the largest unwrapped region is shown in Figure 6. The sea area is not unwrapped, as in the region-growing algorithm. However, the CL algorithm has not been able to join a large area in the bottom left of the interferogram into the main unwrapped area, so this area is shown black in Figure 6.
Several black linear features are noted in Figure 6, for example, the 3-part line segment around range cell 384, range line 361 (counting from the top left of the image). These lines occur when cut lines connect residues which are fairly far apart. They often represent unwrapping discontinuities across which ambiguity errors occur.
Because this implementation of the CL algorithm can have an arbitrary phase offset, the absolute phase of the unwrapped result is adjusted so that a comparison can be made with the region-growing algorithm. This is done by setting the average phase difference to zero over a portion of interest in the unwrapped interferogram. We have used the high-coherence upper middle portion for this purpose, because it is in the middle of the area studied in the next section.
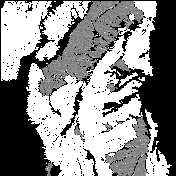
After making this adjustment, the unwrapped phase values of the CL and the region-growing algorithms are compared pixel by pixel. The difference between the unwrapped data in Figure 5 and Figure 6 is shown in Figure 7. In this figure, unwrapped phase differences in the range (-pi, +pi) are shown linearly from black to white, and the differences with an absolute value larger than pi (corresponding to a phase difference of one ambiguity or greater) are shown in white. Areas which have not been unwrapped by both algorithms are shown in black.
In the central part of the interferogram, where the coherence is generally high and the topography is not too steep, the two algorithms agree generally, except a difference of one ambiguity interval (2pi) between the upper and lower parts. However, other areas, like the areas at the top left of the interferogram which are almost completely isolated from the central part by ridges of steep topography, have a large ambiguity difference.
Note that in the gray upper middle region, small differences of fractions of pi exist between the two algorithms, even though the ambiguities agree. This is because the CL algorithm can change the fractional part of the phase during a smoothing operation. In contrast, the region-growing algorithm does not change the fractional part of the phase from the original interferogram.
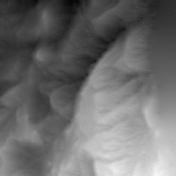
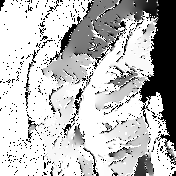
In the central part of the interferogram where coherence is generally high and the topography is not too extreme, the three algorithms give comparable results. However in the left part of the interferogram, which is almost completely isolated from the central part by a ridge of steep terrain, the disagreement between the three algorithms is obvious. In these cases, ground truth can be used to resolve and understand the differences, thereby helping to evaluate the unwrapping quality of the three algorithms.
As digital elevation model (DEM) data for the whole interferogram was not available to us, elevation data from a 1:25,000 topographic map for one range line is used to compare the algorithms. Range line 127 (1/4 of the way down the image) is chosen because all three algorithms unwrapped most of the pixels on this line, and challenging topographic features are present along the line.
Note that the WLS algorithm provides a smooth but often inaccurate result over regions of low coherence. See, for example, the region between range cells 101 and 138 where the slope has been reversed with respect to the RG algorithm. This effect is not unlike the effect observed by (Bamler, et al., 1996) where they observed "cycle slips" in the WLS algorithm in regions of low coherence and high surface slope.
In Figure 10, the fine structure of the phase of the 3 results agree reasonably, but major differences exist in the ambiguity levels. The map elevations will be used to identify which of these solutions is best.
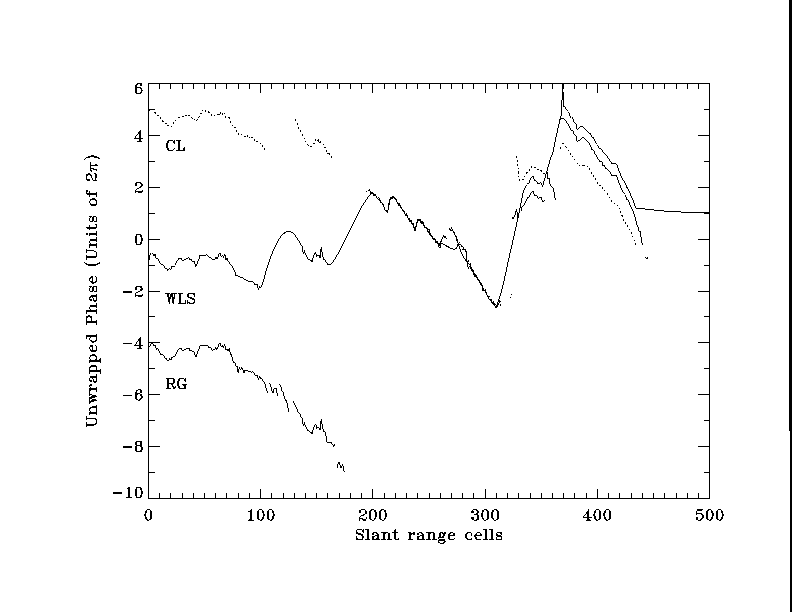
Before a comparison can be made with the map elevations, the flattening of the phase values must be improved. This was arbitrarily done by adding the same constant slope to the unwrapped phase of each result so that the phase in the high-coherence regions of RC 196-312 fit the map elevations closely.
After this flattening refinement and scaling the phase to elevation, the phase-derived elevations are compared with the map elevations in Figure 11. The thick solid curve represents elevations read off the map. The medium
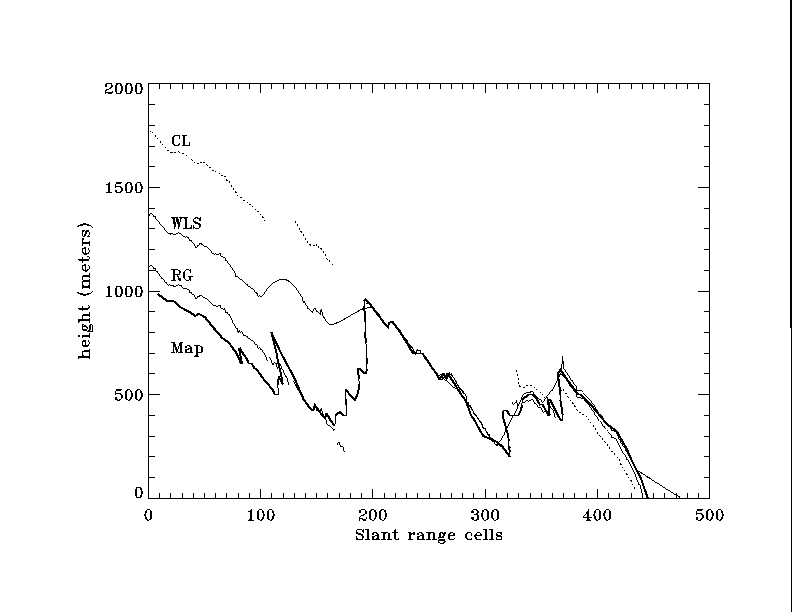
Note that over most of the figure, the phase-derived elevations are parallel to the map elevation. This attests to the effectiveness of the flattening operation. Note also that the slant range axis sometimes reverses itself in the case of the map data. This is a result of the ground range to slant range conversion used when interpreting the map data, and indicates regions of SAR data layover.
From the comparison in Figure 11, the following observations can be made:

In this comparison with map data, the RG algorithm has proven to be less susceptible to large errors that can occur in noisy areas of the interferogram. This is largely because of the ability of the RG algorithm to venture deeper into noisy regions, attempting to work its way through from many different directions. As a result, the comparison illustrates the effectiveness of the region growing algorithm in unwrapping difficult areas.
In the authors opinion, the CL algorithm results in unwrapping errors because it cannot avoid linking the wrong pairs of residues when the residue density is high. Also, the WLS algorithm results in unwrapping errors because it tries to fit the unwrapped phases to a smooth model in low-coherence areas, which is not valid in areas of significant topographic changes.
While these detailed observations were made after examining one line of map data, it can be inferred from the unwrapping structure seen in Figures 5 to 9 that our observations will likely apply to other areas of the interferogram. It is hoped to examine other range lines in the future.
We have compared the region-growing phase unwrapping algorithm with two of the most popular algorithms available. We have used the Sardegna image for the comparison, because it has extreme topography, which has caused problems for many phase unwrapping algorithms. We have shown that the region-growing algorithm can successfully unwrap further into the low-coherence regions than the other two algorithms, and makes fewer ambiguity-level errors. This is because of its ability to work across and around low-coherence regions, which results in more accurate connecting of the high-coherence regions. This results in a higher proportion of the interferogram being unwrapped, and more regions being joined into one contiguous region.
While we believe that the region-growing algorithm is effective on the difficult Sardegna interferogram, it should be stated that this effectiveness comes at a considerable computing time disadvantage. We are presently trying to improve the efficiency of the RG algorithm, but at this time, it takes many times longer to run than the other algorithms. This means that the other two algorithms would be preferred for interferograms which do not exhibit the same degree of difficulty as the Sardegna interferogram.
The authors would like thank Dr. Ian Joughin of the Jet Propulsion Laboratory for unwrapping the Sardegna data using the "cut-line" algorithm and Dr. Marcus Schwaebisch of the German Aerospace Research Establishment (DLR) for the unwrapping by the "weighted least squares" algorithm. The authors are also grateful to Mike Seymour of UBC's Radar Remote Sensing Group for advice in interferometric processing and for proofreading the manuscript.
Funding for this work was provided by the NSERC/MDA Industrial Research Chair in Radar Remote Sensing.
(Conference Program)
![]() (Participants)
(Participants)
![]() (Abstracts and Papers)
(Abstracts and Papers)
![]() (Contacts)
(Contacts)