Simulator for Repeat-Pass Satellite InSAR Studies
*Wei Xu and Ian Cumming
Department of Electrical and Computer
Engineering
The University of British Columbia
2356 Main Mall, Vancouver, B.C. Canada V6T 1Z4
Tel: (604) 822-4162, Fax: (604) 822-5949,
Email:
weix@ee.ubc.ca
* Presented at IGARSS'97, Singapore, August 3-8, 1997.
Published on pages 1704-1706 of the proceedings.
CONTENTS
0. Abstract
1. Introduction
2. Satellite geometry model
3. Insar displacement model
3.1 Displacement in azimuth direction
3.2 Displacement in range direction
4. Insar phase shift model
5. Insar Noise models
5.1 Multiplicative speckle noise
5.2 Additive receive noise
6. Test and demonstration results
7. Conclusions
An Interferometric Synthetic Aperture Radar (InSAR) simulator has been developed for testing and optimizing InSAR processing algorithms. With the help of the InSAR simulator, the errors introduced by the InSAR processing algorithms can be isolated and quantitatively detected. The InSAR simulator takes one SAR complex image, and uses a geometry model and noise/error models to create a second image as would be collected from a second SAR antenna. Examples of the application of each module are given, illustrating the performance of the InSAR simulator and the generation of realistic SAR interferograms.
This work is sponsored by the Canada Centre for Remote Sensing, Macdonald Dettwiler and Associates and the Natural Sciences and Engineering Research Council (NSERC).
There are many open research topics in SAR interferometry. These vary from optimization of the processing algorithms to developing new applications of interferometry. All of the algorithms and applications need a performance verification. While no SAR image pairs with controlled error and known ground truth are available, a simulator seems to be the most practical tool for measuring algorithm accuracy. The InSAR phase values are subject to a number of error sources
[1-3]. Examples of the errors are receiver noise, processing errors, phase aliasing caused by steep terrain or excessive phase noise, temporal decorrelation, and baseline speckle. Errors embedded in the input parameters are also passed on to the resultant interferogram. They are errors in the estimated satellite orbit and baseline and other registration errors.
We have developed an InSAR data simulator which creates a second (slave) complex image from a given (master) complex image, in which the slave image contains a controlled subset of the noise sources listed above. A real SAR image can be used as the master complex image. This makes the simulated SAR inteferogram as realistic as possible. It is possible to turn each error source on and off independently, as well as to control the magnitude of each error independently. The InSAR simulator is written in ANSI C under the UNIX operating system with a convenient I/O interface. An additional function of the InSAR simulator is to evaluate the effect of satellite and radar parameters on InSAR results.
Parallel orbits are assumed at this stage for simplicity. In such case, the baseline length and elevation angle are fixed throughout the whole scene, the azimuth and range displacements are separated. It is sufficient to assume the earth surface and satellite motion are flat in the azimuth direction for simplicity.
The geometry of an InSAR system is shown in
Fig. 1, where O is the center of the earth; A is the master SAR antenna at time t=0; A is the slave SAR antenna at time t=0; R is the radius of the earth assumed locally spherical in the range direction; H is the altitude of the master SAR antenna; B is the baseline at time t=0; w is the elevation angle of the baseline; V is the motion direction of the master and slave SAR antenna, and it is defined as the direction of the x-axis when the SAR is left looking or its opposite direction when the SAR is right looking; W is the local off-nadir angle. The positions of the master SAR antenna (xa , ya , za) and the position of the slave SAR antenna (xa' , ya' , za') as functions of time t are :xa = tV ; ya = 0 ; za = R + H (1)
xa' = tV ; ya' = Bs ; za' = R + H + Bs (2)
where V is the projection of V on the x axis, and Bs, Bc are
![]() ;
; ![]() (3)
(3)
Given the coordinates in the slave image (x' , r's) and DEM, the coordinates in the master image (x, rs) can be obtained by :
x' =x + xo (4)
![]() (5)
(5)
where x0 is slave image shift in azimuth and
![]() (6)
(6)
![]() (7)
(7)
Fig. 1 Geometry of an InSAR system 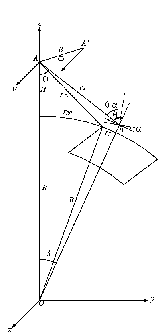
3.1 Displacement in azimuth direction
The displacement in the azimuth direction is simple and constant throughout the whole scene.
x = x' + x0 (8)
As the multiples of sample interval, daz can be removed by shifting the line in the master SAR image, the range of x0 can be restricted to one sample interval [0, 1).
For a pixel (x',r's) in the slave complex image, its backscattering coefficient
s'(x',r's) is calculated from the corresponding point in the master complex image. If (x', r's) is not on the grid in the master complex image, an 8-point sinc interpolator is used for azimuth interpolation.
3.2 Displacement in range direction
Let rs1 and rs2 have their corresponding value of r's1 and r's2 satisfies:
![]() (9)
(9)
Then the approximate value of rs for the given r's is obtained by the following linear interpolation
![]() (10)
(10)
An 8-point sinc interpolator is used for range interpolation.
INSAR PHASE SHIFT MODEL
The noise-free backscattering coefficient
s'b(x', r's) for the slave image can be calculated from the noise-free backscattering coefficient sb(x, rs) for the master image by applying the range-dependent phase shift:![]() (11)
(11)
NSAR NOISE MODELS
5.1 Multiplicative speckle noise
Multiplicative speckle noise can be used to simulate temporal and baseline decorrelation. Let the SAR images with multiplicative noise be
sbm(x, rs) and s'bm(x', r's), then![]() (12)
(12)
![]() (13)
(13)
where
nm and n'm are independent Gaussian random processes with zero mean and standard deviation determined by the temporal and baseline decorrelation. With (11) we have![]() (14)
(14)
![]() (15)
(15)
Assuming that ![]() , we have
, we have ![]()
Let the SAR image with both multiplicative noise and additive receiver noise be
s'bma(x', r's) and sbma(x, rs)
![]() (16)
(16)
![]() (17)
(17)
where
na and n'a are independent Gaussian random processes with zero mean and their standard deviation can be determined by the thermal noise level of the SAR image. With (14) we have![]() (18)
(18)
![]() (19)
(19)
Assuming that ![]() , we have
, we have ![]()
A real complex SAR image and an artificial DEM shown in Fig.2a is used to test and demonstrate the functions of the InSAR simulator. The real SAR image serves as the master SAR image in the experiments. A simulated SAR interferogram with phase shift only is shown in Fig.2b. Only round-off errors occur in this experiment.
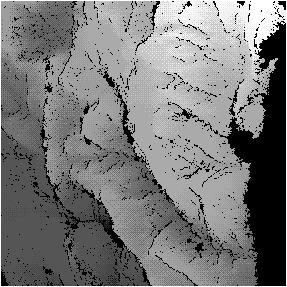
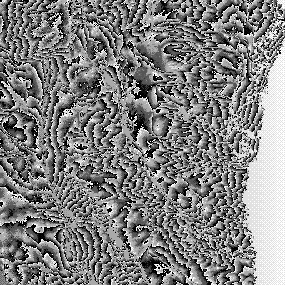
Fig. 2 a) DEM; b) A simulated SAR interferogram without noise and displacement
A simulated SAR interferogram with baseline decorrelation multiplicative speckle noise is shown in Fig.7a. Various scaled multiplicative speckle noise is added in the simulation. The resultant phase error as a function of the equivalent correlation coefficient is shown in Fig 3. A simulated SAR interferogram with additive noise is shown in Fig.7b. Various additive noise is added in the simulation. The resultant phase error as a function of the SNR coefficient is shown in Fig.4.
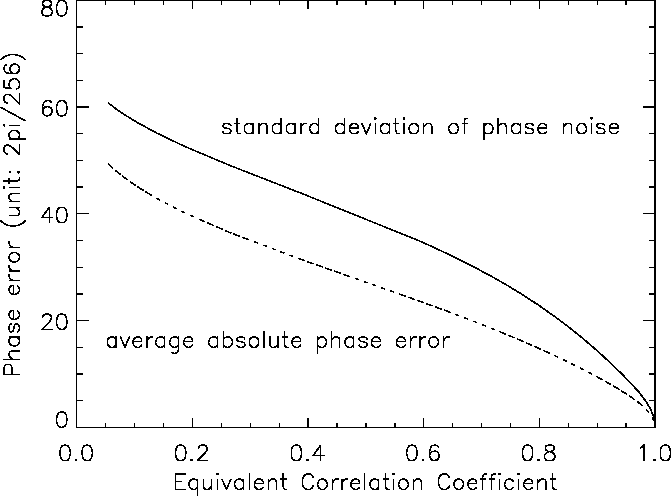
Fig. 3 Phase error as a function of the equivalent correlation coefficient
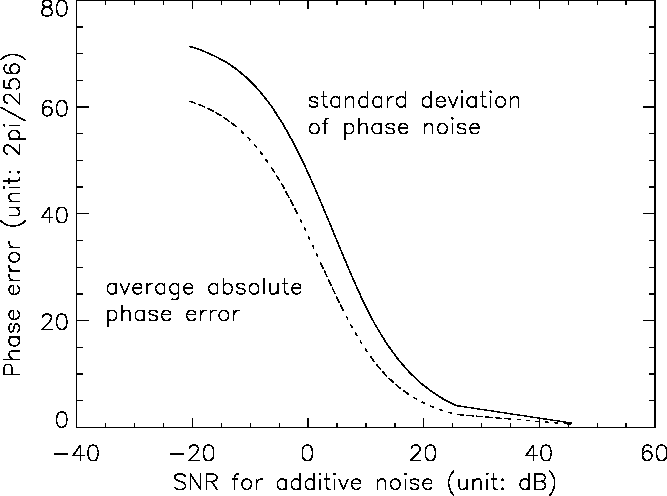
Fig. 4 Phase error as a function of the SNR for additive noise
A simulated SAR interferogram with a large azimuth displacement (0.5 pixel) is shown in Fig. 7c. With various azimuth shifts, the resultant phase error as a function of the azimuth displacement is shown in Fig. 5. The phase error without azimuth displacement is caused by range interpolation error. Without any azimuth displacement, the range parameter is varied to demonstrate the effect of range displacement. A simulated SAR interferogram with a large range displacement (about 0.5 pixel of average displacement) is shown in Fig. 7. With various range displacements, the resultant phase error as a function of the average range displacement is shown in Fig. 6.
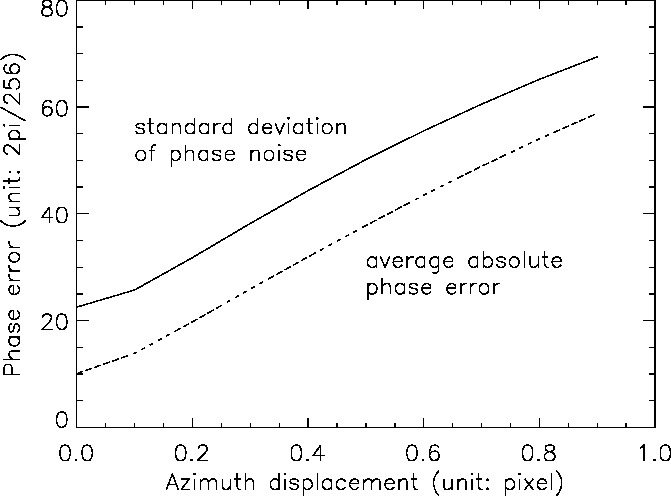
Fig. 5 Phase error as a function of the azimuth displacement
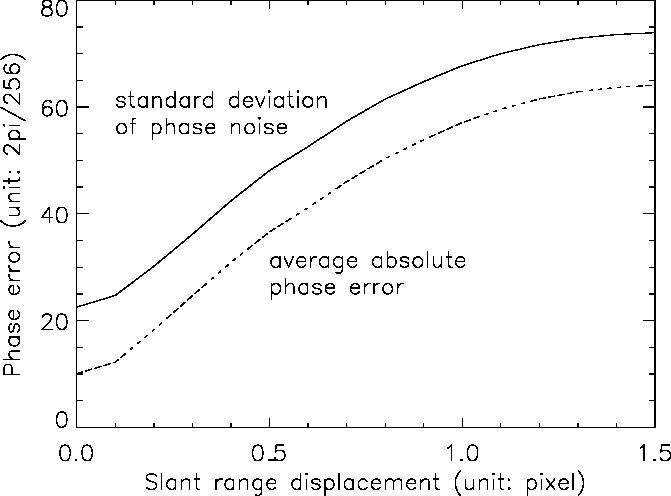
Fig. 6 Phase error as a function of the average range displacement
|
a |
b |
|
c |
d |
Fig. 7 Example simulated SAR interferograms with a) baseline decorrelation; b) additive noise; c) azimuth displacement; d) range displacement
The test experiments show that the simulator is reliable for the following reasons: both average absolute phase error and the standard deviation of phase noise should be zero when there is no noise or displacement; the average absolute phase error should be ![]() and the standard deviation of phase noise should be
and the standard deviation of phase noise should be ![]() when the noise or displacement dominates the data.
when the noise or displacement dominates the data.
CONCLUSIONS
The flexibility and accuracy of the InSAR simulator has been demonstrated by the examples. It can generate very realistic SAR interferograms, and quantitatively controllable errors can be added into the output to simulate various error and noise sources in a real InSAR system, and to test the performance of InSAR processing algorithms like phase unwrapping algorithm for example.
[1] Fuk K. Li and R. M. Goldstein. Studies on Multibaseline Spaceborne Interferometric Synthetic Aperture Radar. IEEE Trans. Geosci. Remote Sens., 28(1):88-97, Jan. 1990.
[2] Howard A Zebker, Charles L. Werner, Paul A. Rosen, and Scott Hensley. Accuracy of Topographic Maps Derived from ERS-1 Interferometric Radar. IEEE Trans. Geosi. Remote Sens., 32(4):823-836, July 1994.
[3] D. R. Stevens, I. G. Cumming, A. L. Gray, and M. R. Ito. Airborne Interferometric SAR: Terrain Induced Phase Errors. In IGARRSS'93, pages 977-979, Tokyo, Japan, 1993.
Last updated: Tues, 2nd Sept 1997 13:04:06 by
Ian Cumming